


Overview
- There are many system-monitoring tools on the market—many of which are offered to customers by hosting providers as part of a hosting package—but, often, these tools are limited in their capabilities and require too much manual effort to be used as a standalone.
- A favored tool by experts in the know is the PRTG network-monitoring tool.
- The PRTG tool is valued for its open configuration, comprehensiveness, flexibility, proactive notifications, and ease of interaction.
When we last discussed the top three issues to look out for in determining whether hosting for your CTRM system is set up correctly, one of the key points I touched on was the need to continuously and proactively monitor your systems for potential problems.
There are all types of automated tools out in the market—many of which are offered to customers by hosting providers as part of a hosting package—that conduct surveillance on different aspects of a CTRM system and alert you to issues with threshold limits, server performance, and system speed and availability.
The problem is, a lot of IT personnel and general users aren’t aware of the full extent of the limits of their hosting providers’ tools—and how big the gap is between what these tools actually do versus what companies need them to do. Not being aware of better products on the market, they end up engaging in a lot of manual effort.
Which leads to the next question I get asked a lot: Is there a particular monitoring tool I really like and use frequently?
Yes. It’s called the PRTG network-monitoring tool.
It’s a web-based, highly sophisticated—yet fairly easy to install and use—tool that monitors your entire IT infrastructure and gives you as high level or as detailed a view of your infrastructure status as you want, in real time. It can monitor anything from databases and servers to network infrastructure, cloud environments, and applications.
Since I discovered the PRTG tool more than 10 years ago, I’ve leveraged it for every single IT organization I’ve worked with. In fact, even if a client’s hosting provider has their own monitoring tool, I still recommend using the PRTG tool alongside it to complement and enhance it.
So, what do I like so much about the PRTG tool? Here are a few top reasons.
Wide-open configuration
- Extensible platform—it runs on Windows and, therefore, any infrastructure that supports the Windows operating system
- Compatible with all types of data acquisition, such as SNMP, agentless login, and leverages APIs to pull in data from a variety of other sources
- Ability to “talk” across different hosting platforms
- Ability to write a script for anything you want to do
Comprehensive and flexible function
- Monitors all types of activity and metrics, including custom scripts
- Runs on predetermined schedules
- Lets you define and set threshold limits
- Authenticates users
- Enables remote management (the PRTG doesn’t have to be physically connected to the infrastructure it’s monitoring)
- Covers horizontal configurations (infrastructure across many networks) and vertical configurations (all infrastructure in one network location)
- Can be run on-premises or hosted
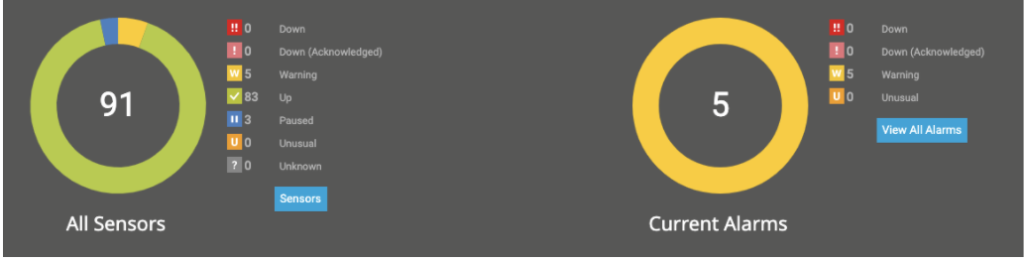
- Gathers and dashboards data for easy and fast viewing and supports 3rd party data integration tools for custom dashboards and similar
- Maintains data for a period of time specified by you
- Lets you define the response for certain issues that arise
- Automates the response workflow
Proactive alerts
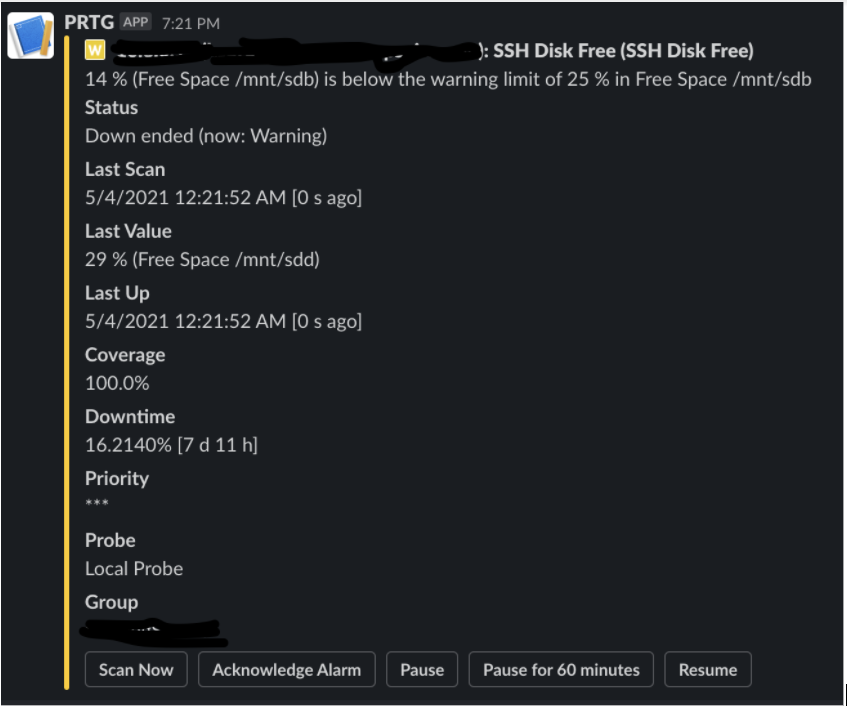
- Automatically creates alerts when threshold limits are breached (If you have want to see an alert when your server reaches 10% free disk space on C:, for instance)
- Alerts create tickets that can be assigned to individuals responsible for maintenance or operations in the assigned area (if you have a database issue, assign to DBA; if you have a server disk issue, assign to a server engineer, etc)
- Allows you to capture comments about the alert, what was done to resolve it, etc
- Color-codes threshold alerts, warnings and status notices for quick, at-a-glance identification of issues
- Notifies IT personnel of issues and enables resolution before other users or outside parties are aware of problems’ potential existence
Easy interaction
- Alerts you via text, email, or other collaborative communications tools (ex., Slack or Microsoft Teams) of problems
- Lets you respond directly to alerts in that space, without having to log in to the program
- Supports web-based login, mobile device app, and desktop app on Windows and Mac platforms for easy interaction
Curious about how your current monitoring tools measure up to the PRTG tool? Want to discuss what you could do differently to improve your system monitoring? Email us at info@capspire.com to set up a consultation.


