


What’s the extent of the problem with rejects?
In a recent study conducted by capSpire’s data science group, we analyzed a dataset of several hundred thousand. Each ticket in this dataset represented a trip to (and usually from) a lease in which haulers collected crude and delivered to stations. In this dataset, first purchasers rejected 2.6% of loads because of high BS&W. If we assume a $150 reject fee charged to each rejected order, the financial impact of rejected crude on producers is $1.5 million. And yet, this $150 fee only covers about half of the first purchaser’s costs. As such, the first purchaser also incurs a $1.5 million cost. Clearly, there is a financial benefit to reducing rejects from both first purchasers’ and producers’ perspectives, and being able to predict rejects and prevent unnecessary trips to leases is beneficial for all parties.
What did the data tell us?
There was no correlation between the number of rejects and geographic region, production volume, sulfur content, hauler company, or the time of year. The rate of rejects varied significantly across different producers of both high and low volume. As such, our initial hypothesis was that the problem was related to operational effectiveness and was therefore preventable. The next step was to try to predict the occurrence of a reject based on time-series data.
We discovered that it was instructive to look at the data for a lease that had a relatively large number of rejected loads during the sample period (one year) to see how the measurement data and patterns of rejected loads might lend itself to detection.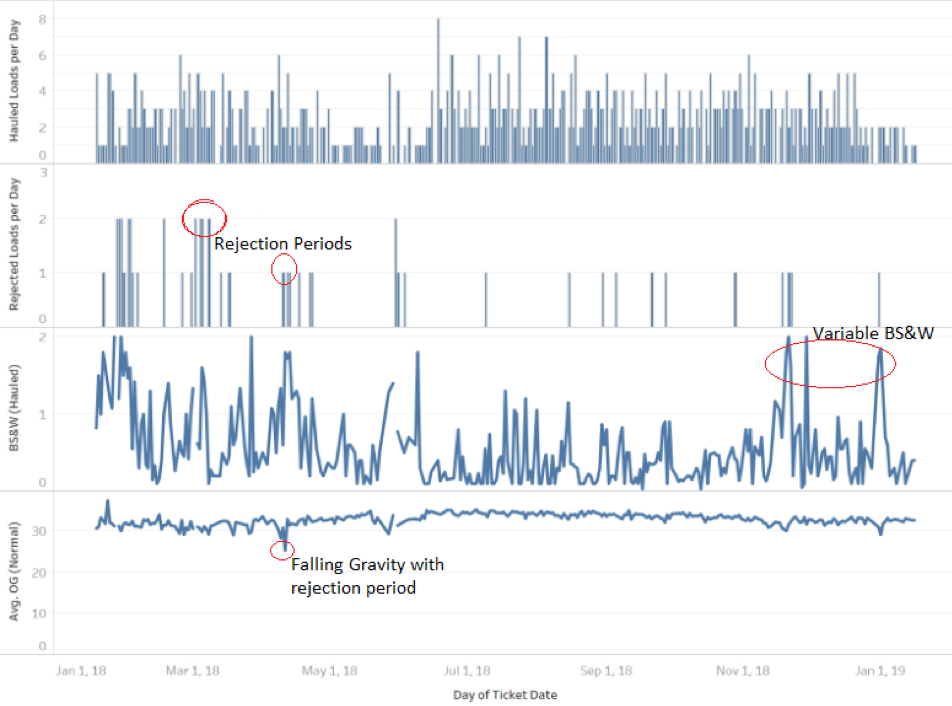
The graphs above are a high-volume lease with multiple loads of crude hauled per day. The rejection of loads with high BS&W content occurs periodically and in clusters during which a certain fraction of loads are rejected over a period of a week or two. Not all loads are rejected during such periods; rather, there is a high probability of rejecting loads during the rejection period. As illustrated in the graph above, the BS&W measurements vary while observed gravity measurements are much less volatile. Hence, our prediction algorithm uses the observed gravity measurement and the leading indicator of a rejected load to predict future rejects.
What was the final conclusion?
There is a good statistical and chemical reason to believe that measured BS&W increases and observed gravity decreases prior to and during rejection periods. This is because a standard barrel produced in the sample region would likely have a gravity measurement between 35 and 45. Water has a gravity of 10. When mixed with sediment, the gravity measurement would be even lower. As the water and sediment content rises, the API gravity falls. As such, rising BS&W levels and falling gravity are leading indicators of a load that will be rejected.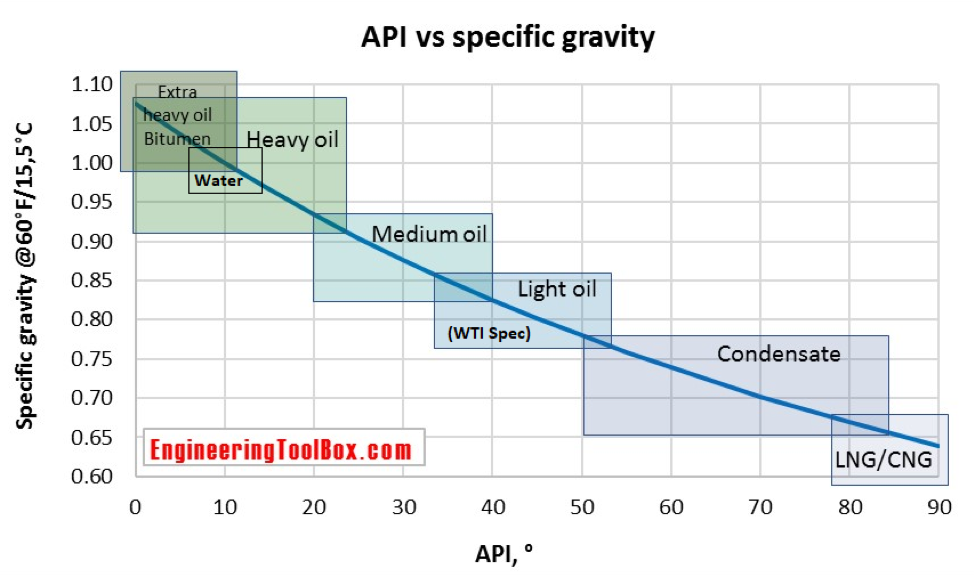
The prediction algorithm that we developed flags a lease when a rejected load is potentially within a rejection period. Then the algorithm tracks observed gravity and hauled BS&W measurements relative to averages of recently observed gravity and hauled BS&W values. The lease remains flagged until observed gravity and BS&W values normalize. This prediction method involves a modest change to hauling procedures but reduces rejected loads by 40%. This saves first purchasers and producers $1.4 million in this sample dataset.
In the second part of this blog series, we will discuss the proposed testing procedure and results of the cost-benefit analysis. For more information contact info@capSpire.com. Posted by Thomas Hunt, the original analysis conducted by Neil Keon, P.H.D.
 |  |
capSpire provides the unique combination of industry knowledge and business expertise required to deliver impactful business solutions. Trusted by some of the world’s leading companies, capSpire’s team of industry experts and senior advisors empowers its clients with the business strategies and solutions required to effectively streamline business processes and attain maximum value from their supporting IT infrastructure. For more information, please visit www.capspire.com.
About capSpire