


If you’re a retailer in the commodities industry, demand forecasting is critical for understanding how much product to purchase wholesale to keep inventory at optimal levels and avoid losing money. But successfully managing data from multiple sources and leveraging it so that you have the most accurate demand forecast can be challenging. You’re probably wondering: How can I minimize my external data needs and make short-term demand forecasting a more lightweight, simple process, while maintaining a high degree of accuracy?
The answer is to use time series analysis.
The following information applies to any commodity, but here we’ll focus specifically on the residential electricity market in Texas as our example of how to improve and simplify demand forecasting.
Our Commodities Example: The Residential Electricity Market in Texas
The Electric Reliability Council of Texas (ERCOT) operates an electric grid that provides power to more than 25 million Texas customers, and has published robust electricity load models.
ERCOT has a complex, multivariable demand model. It incorporates coefficients for 53 variables: 22 binary variables (ex., the day of the week) and 31 continuous valued variables (ex., temperature, cloud cover, humidity, wind speed) that can help to predict a load profile for a particular region and class of electricity customers. Reproducing, much less maintaining and running, a real-time version of this model just isn’t practical.
Our Approach
We’ll determine how to accurately predict electricity demand 10 days in advance using temperature forecasts.
Time series analysis serves as the basis for the demand forecast. In this type of model, tracking selected independent variables over a defined period enables forecasting predictable fluctuations in demand according to a prevailing trend, such as peak versus low periods. Many of these factors, such as weather, are persistent for days at a time, and others are cyclical, such as day-of-week effects.
We adopt this approach because many factors that cause demand changes are contained implicitly in the demand data and can be trusted to be persistent for days at a time, when we are interested in forecasts of only single days.
As such, recent history of electricity demand is sufficient all by itself as a model of past electricity loads.
The Black Box Time Series Model: Historical Demand Data Only
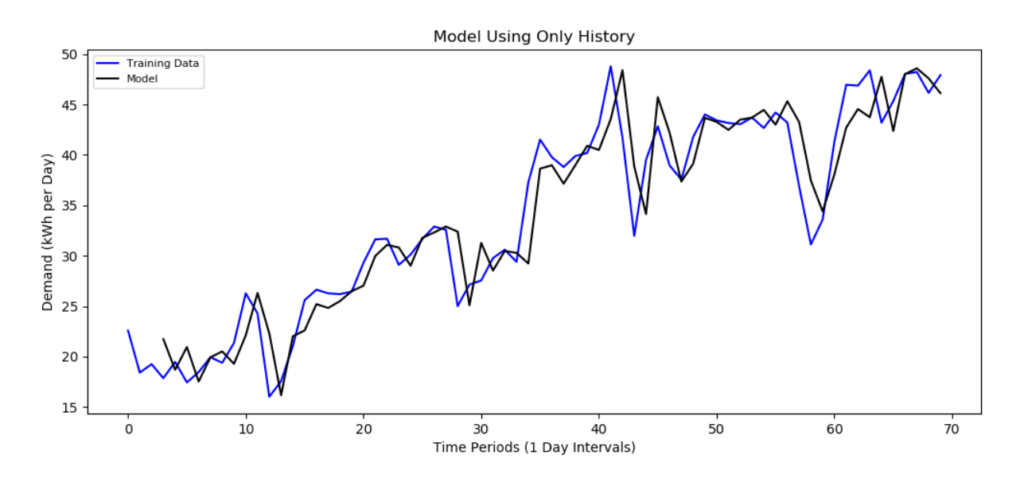
This time series model shows 70 days of electricity demand within a particular population of residential customers in North Texas, the region surrounding Dallas. The blue line represents actual data and the black line represents the model.
To the non-statistician, this model can reasonably be thought of as a sophisticated moving average. In fact, the model was automatic output from a python library with no manual intervention by a data scientist. In other words, it is a black box model with very limited data.
The model occasionally reflects large changes in demand a day late (ex.,. t=12, t=29), but also anticipates some large changes right on time (ex., t = 34, t=44). Additionally, the model correctly distinguishes between transient changes (e.g., t = 42, 43) and persistent changes (e.g., t = 49 through t = 58).
This model is completely implementable using only the historical data of a service provider, with none of the extra data needs of a typical large-scale regression model.
The problem with the black box time series forecasting model above is the temptation to look at the figure and contemplate a simple, data-light method to forecast demand. Such a naive belief forgets that the historical data contains information about independent causes for the historical observations. That is, changes happen for reasons beyond the simple passage of time.
We can add independent data to our model to attempt to correct this problem.
Adding Independent Data: Temperature
We reran the black box model for 10 extra days to simulate a forecast for a known period of time (July 1 to July 10, 2018).
Additionally, we ran a new model that included daily temperature as an independent variable, also with a 10-day forecast to compare the naive model to the model with independent data. Temperature is a strong predictor of residential electricity demand, and is available as data for forecasts at reasonable time scales for operating a supply chain.
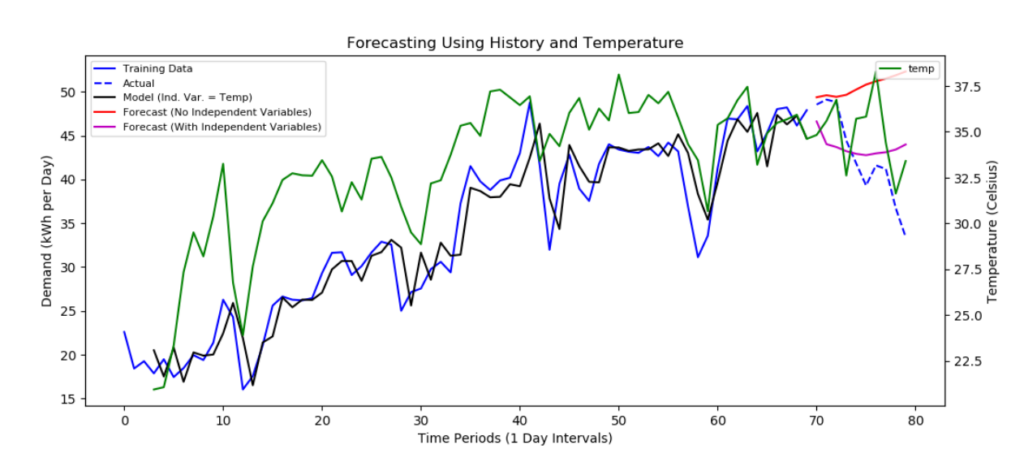
Comparing the magenta line (the model with independent temperature data) to the red line (the black box model using only historical demand data) clearly shows that adding an independent variable significantly improves the forecast. The magenta line tracks the blue line (actual data) much better than the red line. (It should also be noted that the above figure was also generated using automatic output, with no intervention by a data scientist.)
Nonetheless, we concede that the forecasting capability of the model with independent temperature data still isn’t as accurate as we’d like. This enhanced model is not yet sufficient to motivate using this approach to forecast demand.
Why?
Although temperature data improved the forecast, it wasn’t statistically significant. This is because the black box model emphasizes historical data over temperature data. The model needs to be more biased in favor of temperature data to improve demand forecasting.
Compromising Between Fit and Forecast
The model needs to not only align with historical data (fit), but it needs to go out into the future with good predictive value as well (forecasting).
capSpire has created a solution to improve the fit with respect to forecasting potential. We believe the independent variable, temperature, is meaningful. We also believe the black box time series model fits historical data well, where the historical data includes information about underlying changes in demand.
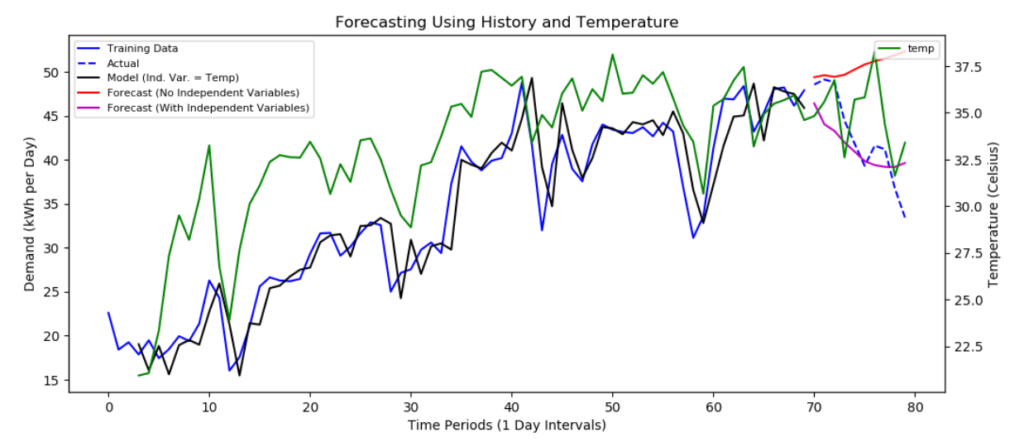
But rather than continuing to allow the model to be fitted automatically, we constrained the fit to de-emphasize historical data. As a result, the independent temperature data became statistically significant within the historical fit.
The result of our experiment is below. Without question, this model is a much better forecaster of electricity demand than the previous two models. Notice how the magenta line (the model with independent temperature data) much more closely tracks the blue line (actual data).
capSpire is in the process of developing a demand forecasting tool that can achieve similar results for general commodities. It will be included within our supply chain optimization platform to further help commodity-focused organizations better manage their supply chains to maximize margins.
Additional features to be developed within this tool will include:
- Intraday forecasting
- Long-time-period forecasting
- Transformation of data outliers into models of significant special events
- Expert user interface (enabling and gathering expert input into the tool to build models automatically using the best features and iteratively best models as selected by the expert user)
Time Series Modeling vs. Multivariable Regression Modeling
Need further proof that time series modeling is a simpler method for achieving an accurate demand forecast?
Pros of time series modeling:
- Lightweight
- Easier to analyze segments
- Most data is captured (historical data factors in the most important variables)
- Reliance on own company history instead of multiple external data sources, which reduces the risk of breakdowns in data
- Repeatability over days and weeks
Cons of time series modeling:
- Lack of clarity on the drivers of demand (behavior is only implied through historical data)
- More focused on predicting short-term future versus long-term strategic forecasting
About capSpire
capSpire provides the unique combination of industry knowledge and business expertise required to deliver impactful business solutions. Trusted by some of the world’s leading companies, capSpire’s team of industry experts and senior advisors empowers its clients with the business strategies and solutions required to effectively streamline business processes and attain maximum value from their supporting IT infrastructure. For more information, please contact us.